The CVE management “tax” doesn't show up as a budget line item. It manifests in consumed capacity, change windows, and lost predictability. This post proposes a simple baseline and shows how Quor’s calculator helps qualify the ROI conversation.

Head of Product
Camila Bedretchuk

In conversations with security, platform, and cloud leadership, a pattern repeats itself: someone opens the dashboard and the diagnosis is immediate. The volume of CVEs is high enough to become a bottleneck, consume engineering cycles, and pressure compliance deadlines. “I am responsible for this number.” “I have compliance to meet.” “I need to prove the ROI.”
The paradox is that, even when everyone agrees on the size of the problem, it does not always become a priority of the same proportion. In technology, almost everything competes for calendar and budget. And, because the cost of vulnerability management is spread across teams and remediation routines, it rarely becomes a single and defensible number.
Without this baseline, remediation becomes a recurring urgency, but rarely a structural decision.
Starting from this scenario, this post covers three points:
Show why this cost is “invisible”, but real and recurring;
Explain why supply chain risk needs to be included in the ROI calculation;
Present how Quor's calculator materializes cost and risk without becoming a “black box”.
Why this cost is invisible and so hard to justify
This cost does not live in a single place. It crosses teams, tools, and delivery cycles.
When someone asks "how much does vulnerability management (CVEs) cost?", the answer almost never comes ready. Not because the cost does not exist, but because it is distributed.
It appears in small blocks throughout the cycle. Over time, it becomes routine and, therefore, does not gain traction when it comes to budget.
In practice, the bill appears as concrete losses:
Diverted engineering hours: triage, investigation, patching, rebuild, testing, and validation.
Planning disruptions: spikes in urgency, war rooms, emergency changes, task forces, and after-hours work to meet deadlines.
Manual governance for compliance: evidences, spreadsheets, audits, and justifications that do not scale.
Displaced strategic capacity: platform, SRE/DevOps, and security step away from strategic initiatives to sustain remediation and change governance.
Without a measurement model, the debate remains asymmetrical: prevention becomes an explicit cost, while the reactive effort remains embedded in the operation, eroding predictability and raising operational risk.
Why software supply chain risk needs to be included in the ROI calculation
If the ROI conversation is limited only to “hours saved in vulnerability remediation”, it measures only the direct cost of remediation. What usually stays out is the exposure: the period in which the organization continues operating with known vulnerabilities while trying to reduce the vulnerability backlog (CVEs).
The software supply chain enters here for two reasons. First, because third parties are already a material factor in the incident landscape. The Verizon DBIR 2025 reports third-party involvement in 30% of analyzed incidents/breaches.
Second, in the software supply chain, especially in open-source dependencies, the time to have a patch available and consumable does not depend only on your team. It depends on the ecosystem (maintainers, releases, and update distribution).
This pace does not always keep up with operational urgency. In dependencies, Sonatype reports averages historically in the range of 200 - 250 days to remedy critical vulnerabilities and cites cases in 2024 exceeding 500 days.
In terms of decision-making, this changes what ROI needs to capture. A consistent ROI in prevention needs to reflect two vectors:
Recovered capacity: less rework and fewer interruptions to reduce the backlog.
Reduced exposure: less dependency on long correction windows in the ecosystem and lower risk originating from the chain.
How the calculator materializes cost and risk without becoming a black box
To make this conversation possible without relying on narratives, Quor's calculator was designed to produce a consistent and comparable baseline with simple operational inputs and explicit assumptions.
To prevent this from becoming “a project to measure the project”, it follows three criteria:
Use inputs that the operation answers quickly, without disproportionate collection effort;
Separate direct cost from exposure, avoiding distortion in the ROI discussion;
Keep assumptions explicit and parameterizable, adjustable to the context (volume, hourly rate, sector criticality, and third-party dependency).
With this, the calculator presents the ROI discussion in two blocks, exactly as they appear in the interface: Remediation and Risk.
First, it makes visible the operational cost absorbed by the operation to fix critical/high CVEs.
Then, it translates the exposure associated with the software supply chain into a financial order of magnitude.
1) Remediation: direct cost absorbed in manual fixes (engineering)
In this tab, the logic is simple and auditable, to give visibility to the cost that the operation already absorbs on a day-to-day basis:
Total critical/high CVEs
= number of images in production × average CVEs per imageTotal hours for remediation
= total CVEs × hours per CVETotal cost for remediation
= total hours × hourly rate
The calculator also shows useful derived metrics for internal discussions, such as average cost per CVE and average cost per image, which help locate where the weight of the problem lies.
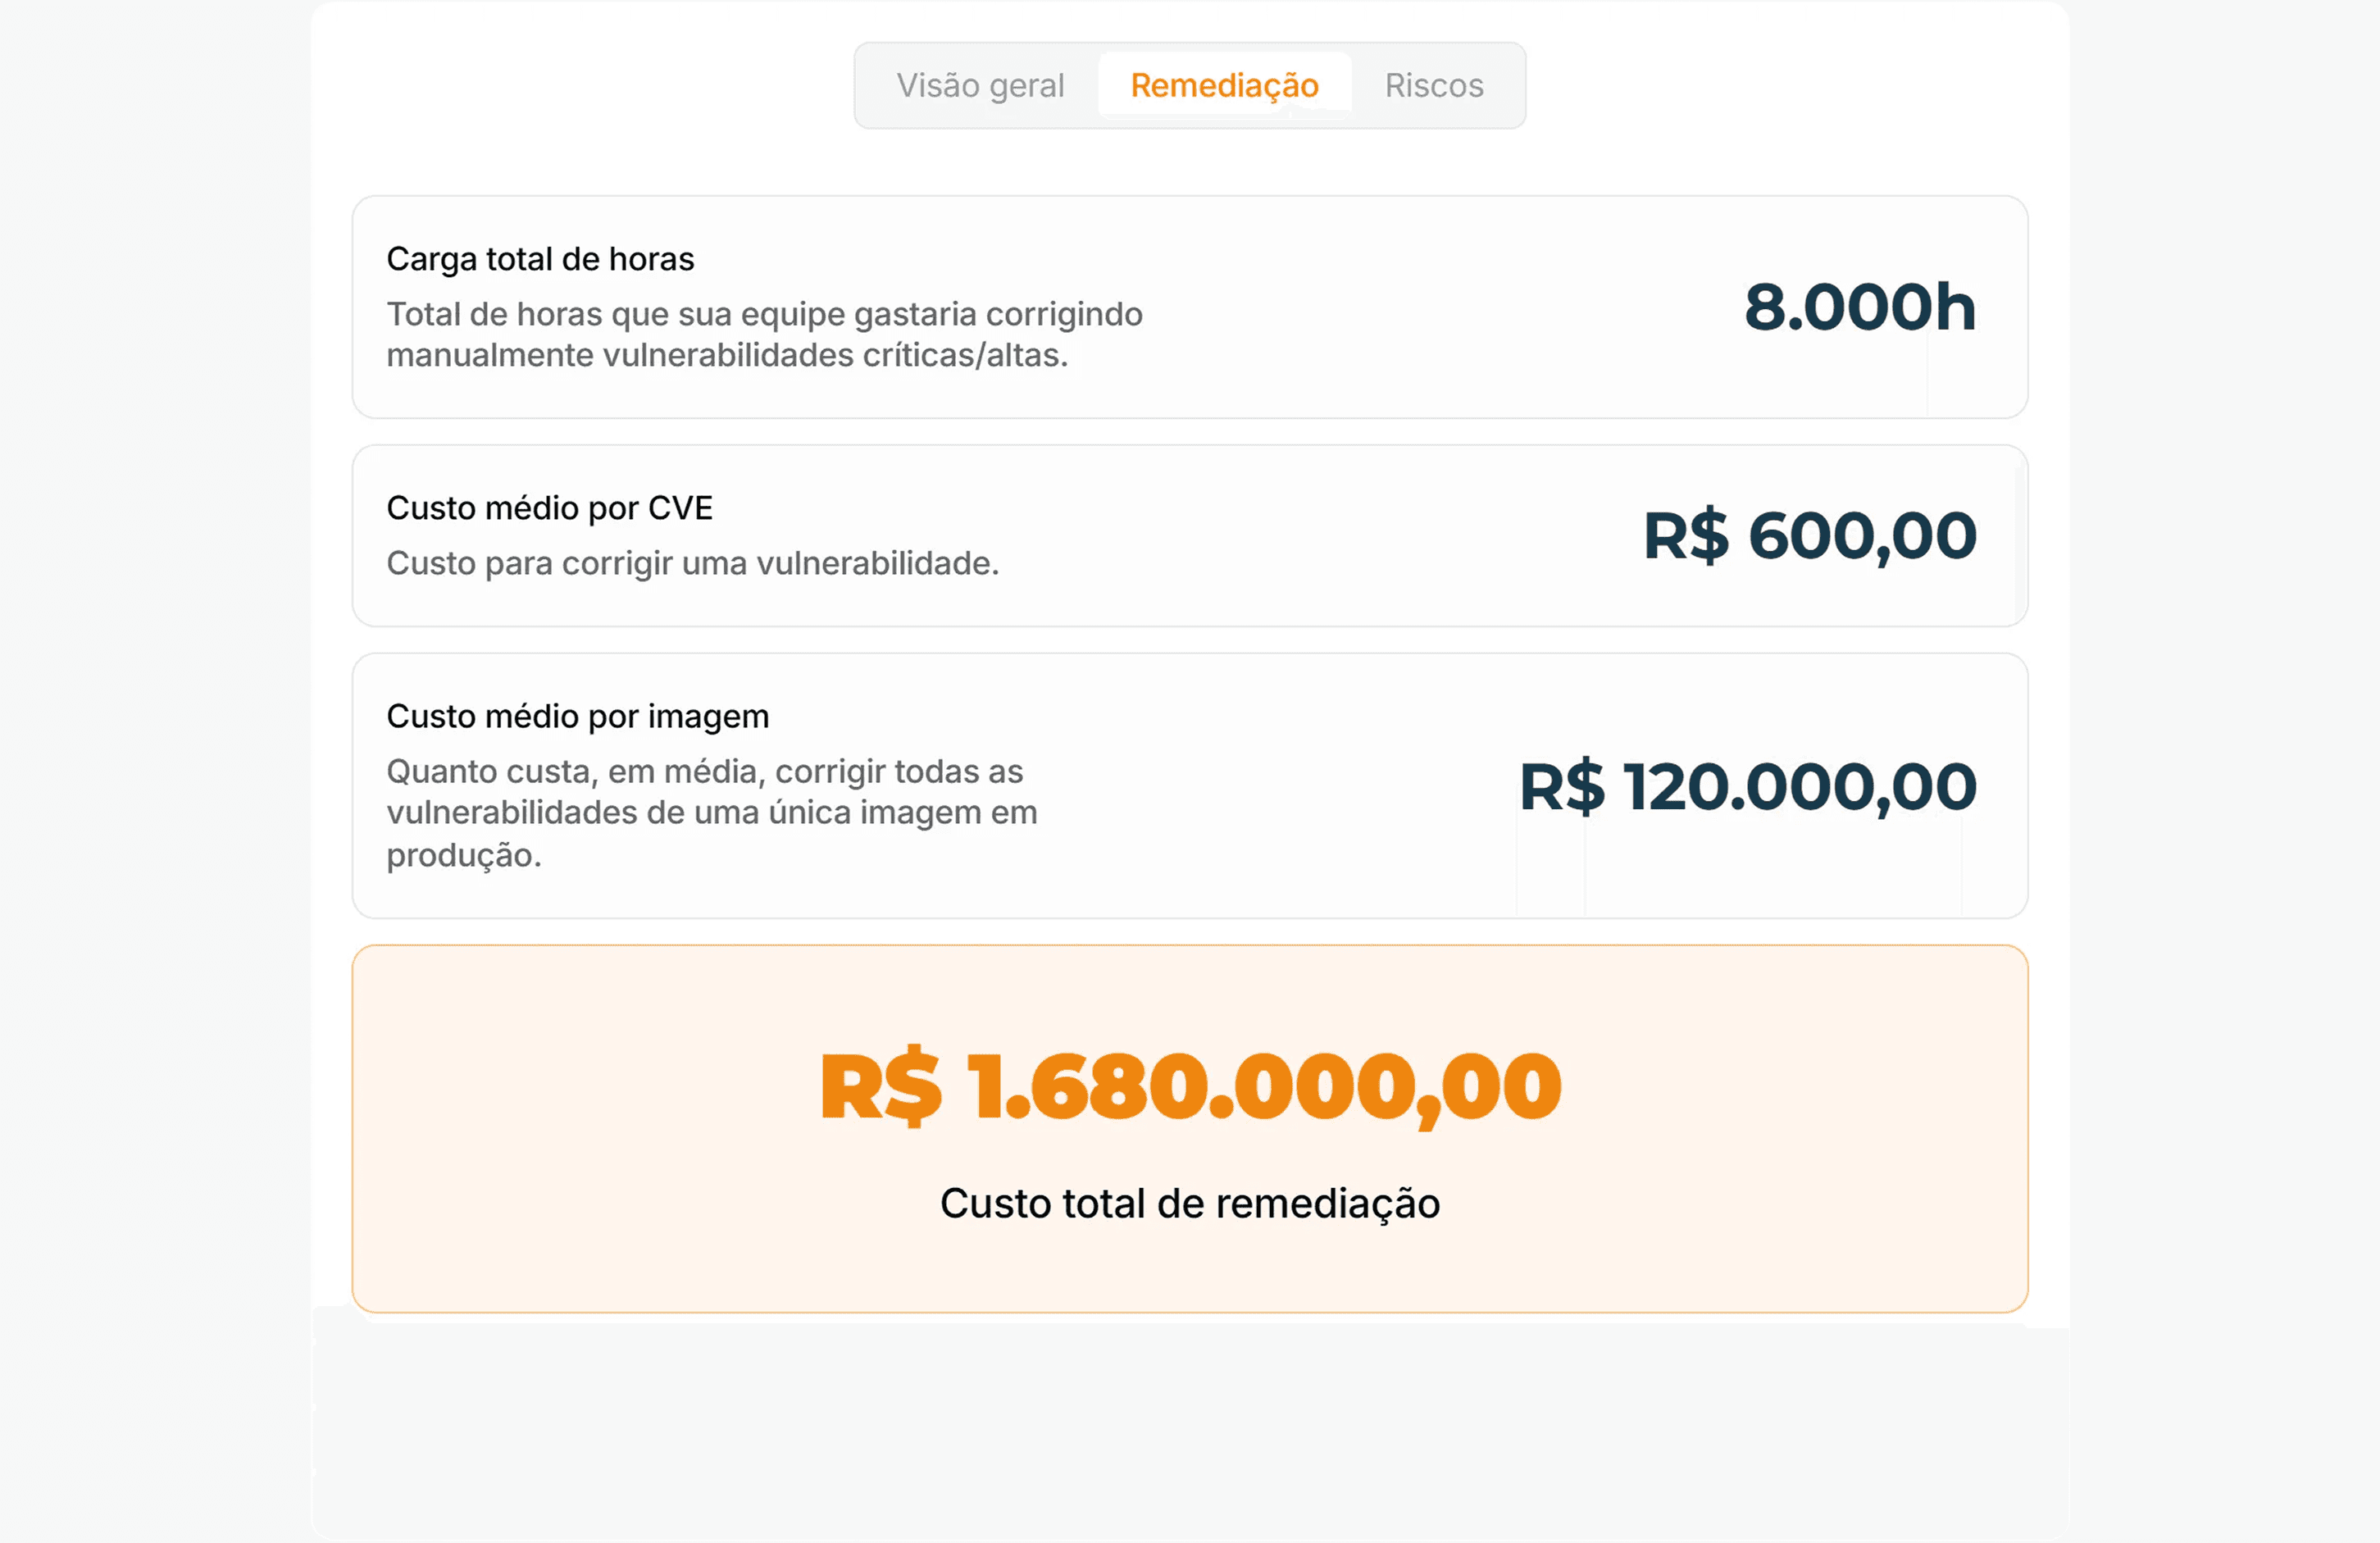
Figure 1 - Remediation Tab: CVEs → hours → cost.
Based on hours per CVE and cost per hour, the calculator estimates the direct cost absorbed by the operation to manually remedy critical/high vulnerabilities in production, a baseline that tends to be distributed among teams.
Note: “hours per CVE” does not boil down to applying a patch. In real operations, a large part of the effort lies in the work around the fix: triage, rebuild, testing, validation, rollout and, mainly, change management (windows, approvals, rollback plan, and evidences).
2) Risk: translating exposure into a financial order of magnitude
On the Risk tab, the calculator follows a classic risk management logic: Annualized Loss Expectancy (ALE). We use this model as a basis and keep the assumptions explicit and parameterizable.
The adaptation here is to adjust the model to better reflect the reality of software operations: adjust the impact to the business sector (criticality/regulation) and isolate the portion attributable to the software supply chain, so that the number represents the exposure associated with the software supply chain, and not a “generic risk”.
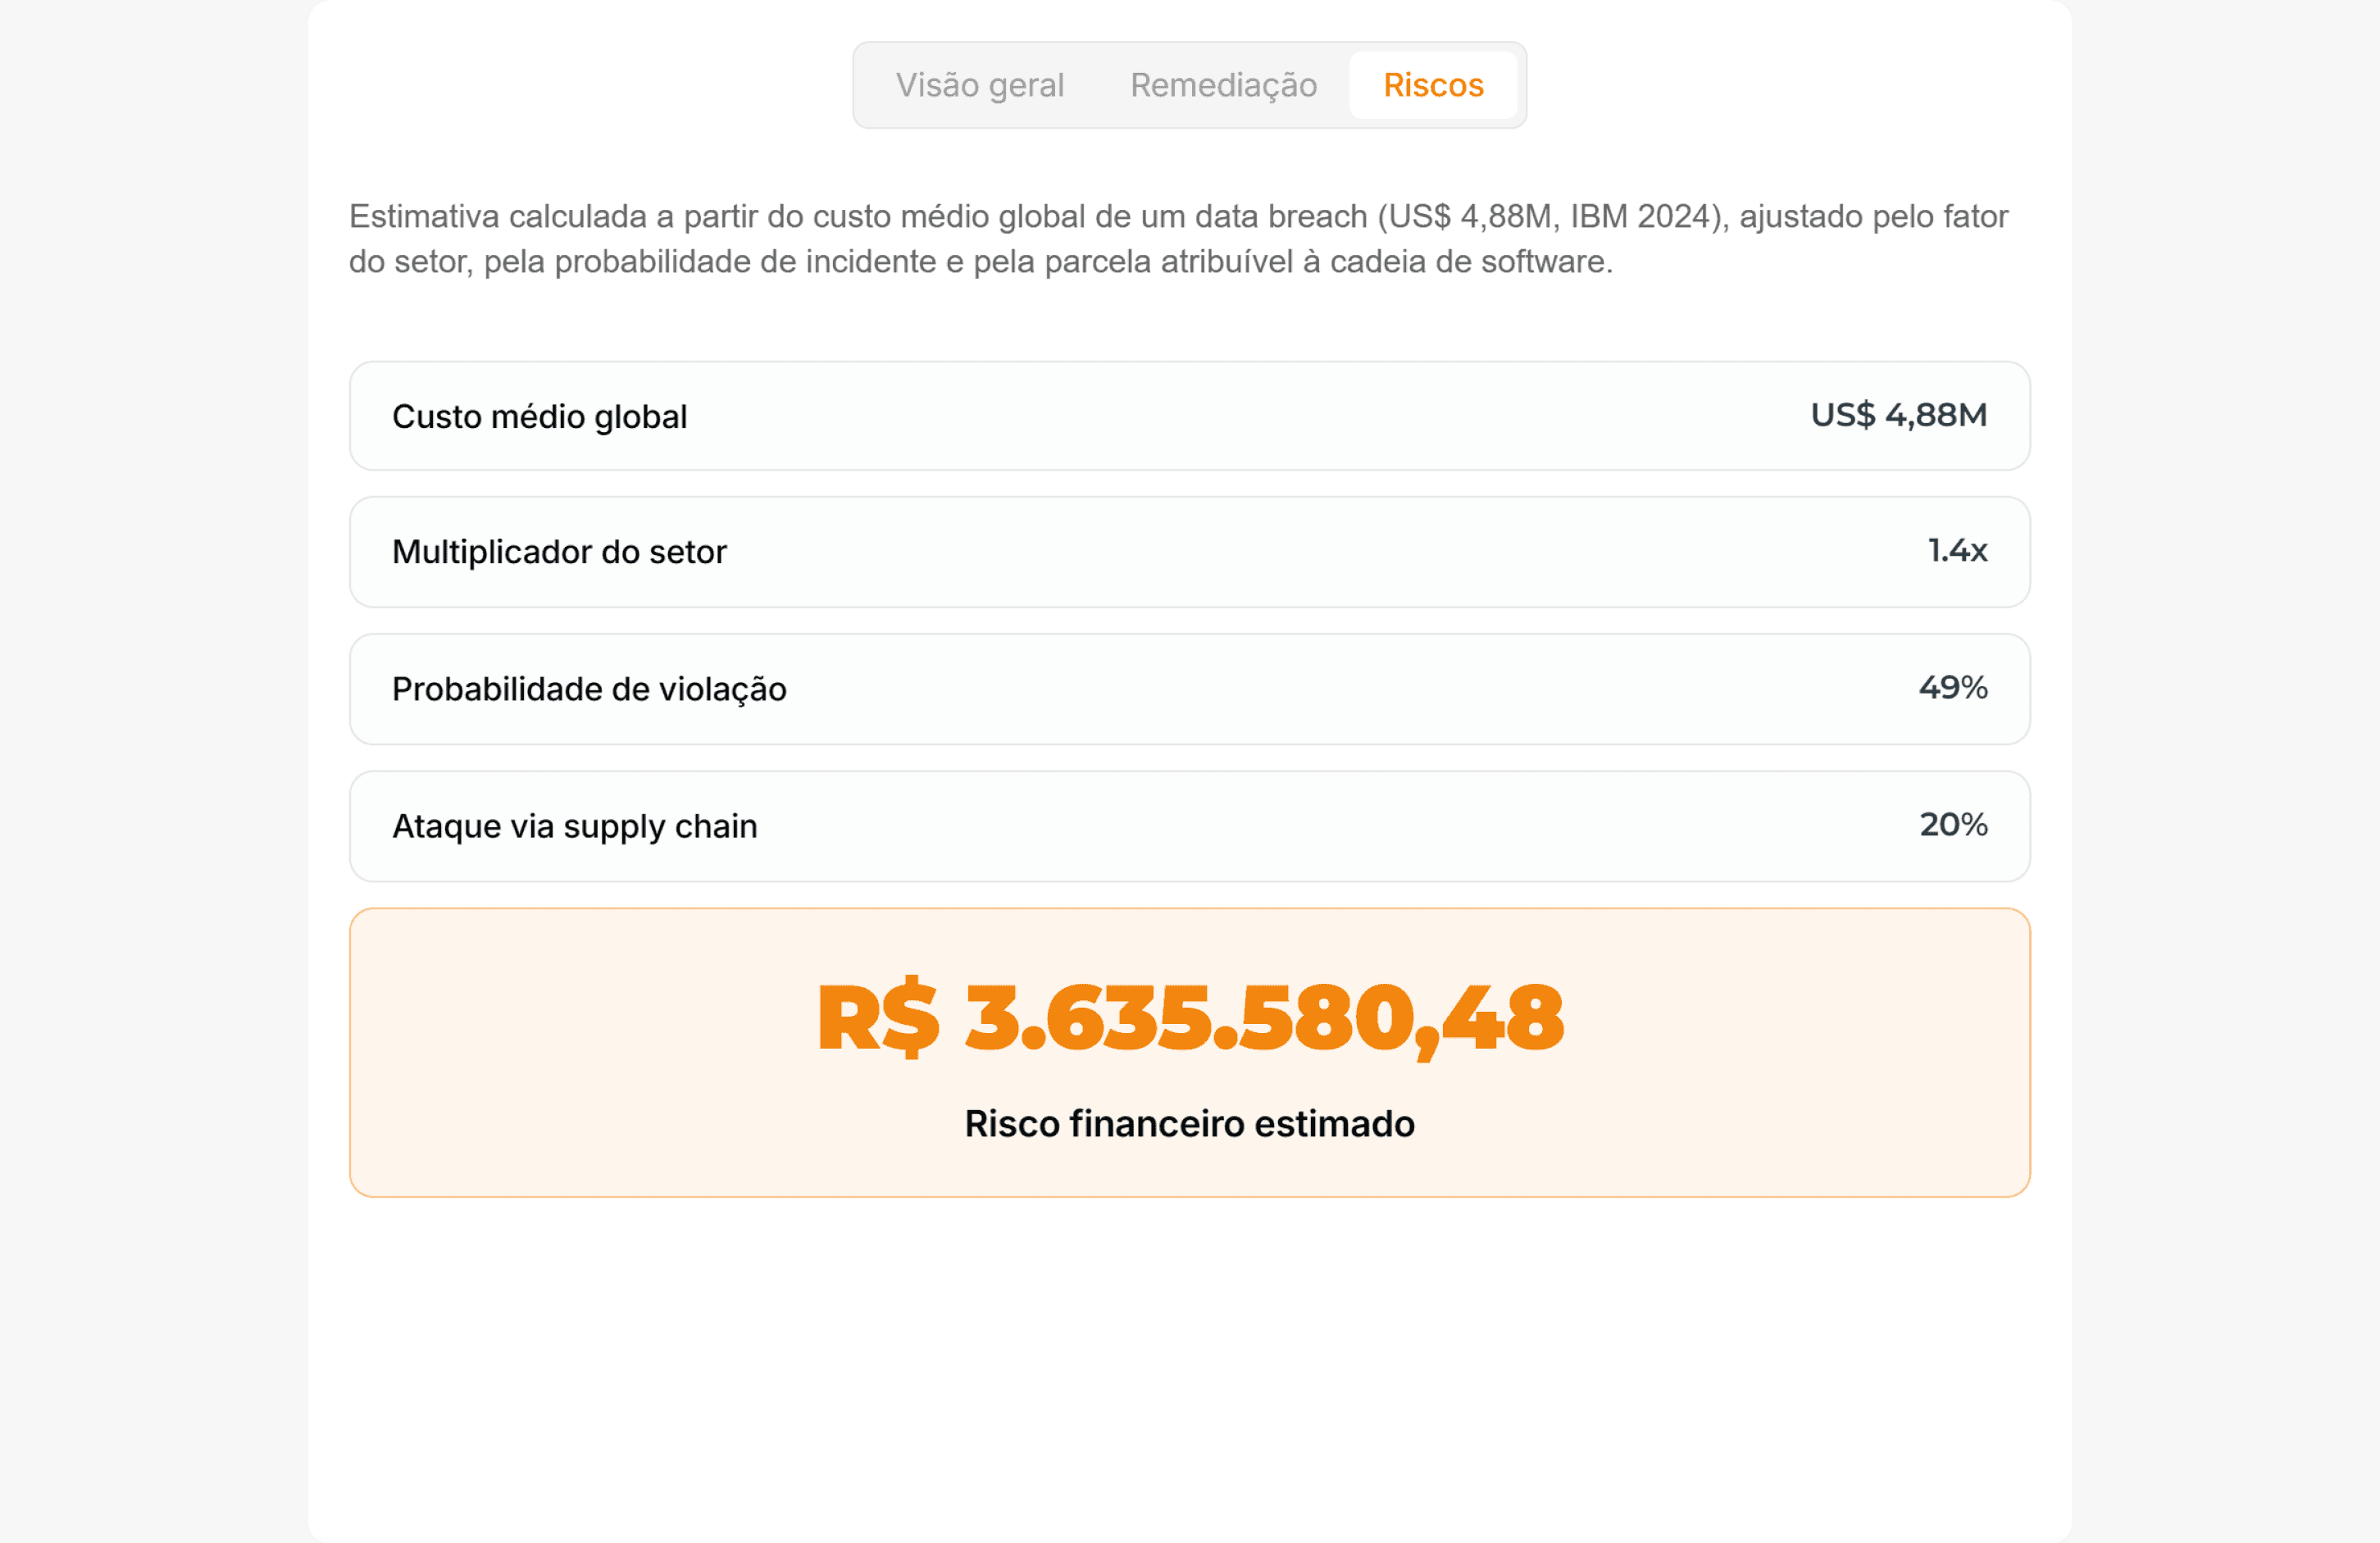
Figure 2 - Estimated Risk (adjusted ALE): benchmark (impact) × sector × probability × software supply chain share
With the operational cost visible and the exposure translated into an order of magnitude, the decision no longer depends solely on perception.
The next step is to apply these two dimensions in the base case scenario and show how the calculation behaves with conservative assumptions.

<CTA_CALCULATOR>

Scenario (financial sector): remediation baseline and impact on the first redeploy
This scenario was extracted from a proof of concept in a real environment.
The goal is to materialize the remediation baseline with simple operational inputs and connect this baseline to the effect observed in the first redeploy with equivalent container images from Quor.
Assumptions (operational inputs)
1,000 critical and high CVEs in production
4 h per CVE (operational average that includes triage, rebuild, testing, validation, and change management)
R$ 150/h (average hourly cost)
Operational baseline for remediation (reactive model)
Total hours: 1,000 × 4 h = 4,000 h
Direct cost: 4,000 h × R$ 150/h = R$ 600,000
Operational reading: 4,000 hours are equivalent to approximately 25 FTE-month (assuming 160 h/month). This cost rarely appears as a budget; it appears as capacity diverted from backlog, roadmap, and structural improvements to sustain remediation.
Financial reading for decision making
In the analyzed scenario, after replacing the images with Quor equivalents and performing the first redeploy, we observed a 93% reduction in critical and high CVEs already in the initial cycle.
Financial summary of the scenario:
Assumptions: 1,000 CVEs | 4 h/CVE | R$ 150/h
Operational Baseline: R$ 600,000
Reduction (1st redeploy): 93%
Estimated cost avoided: R$ 558,000
Annualized Loss Expectancy associated with supply chain (adjusted ALE): R$ 3,895,265
Business Value (order of magnitude): R$ 4,453,265
ROI reading: in this scenario, for every R$ 1 invested in prevention, ~R$ 7 are no longer consumed in manual corrections (order of magnitude based on this baseline and the observed effect).
<NOTA_DE_RIGOR>
Conclusion: measuring does not solve the problem, but it raises the quality of the decision
Measurement does not eliminate CVEs. What it eliminates is ambiguity. As long as CVE Management is treated as a diffuse matter, the organization continues to pay with rework and interruptions without being able to justify a structural investment.
When you put the cost on paper, you can discuss prevention based on what the operation actually experiences: hours, change management, validation, evidences, and prioritization.
This raises the quality of the decision because it takes the debate out of the field of perception and places it in a logic of trade-offs: what continues to be absorbed by the reactive mode and what can be returned to the strategic calendar.
The calculator exists to make this conversation possible quickly: transforming a diffuse problem into numbers that can be reviewed, compared, and defended internally, without depending on narratives or a “sense of risk”.
In the end, the rationale is this: include in the calculation the cost of keeping the current cycle running. And explicit the capacity that returns to the operation when this operational tax decreases.
References
IBM. Cost of a Data Breach Report 2024. 2024.
Verizon. 2025 Data Breach Investigations Report (DBIR). 2025.
SecurityScorecard. Global Third-Party Risk Report (press release). 2024.
Venminder. State of Third-Party Risk Management Survey (2025) highlights. 2025.
Newsletter Getup.
Atualizações sobre Kubernetes e Software Supply Chain Security todos os meses.
Operating Kubernetes in production for more than 13 years. With Quor, this experience extends to software supply chain security as well.
GET UP
© Getup · 2026